Visualization
Visualization
Pipeline Visualization
Learning Rate Schedule Visualization
FAQs
Pipeline Visualization
python tools/visualizations/vis_pipeline.py \
    ${CONFIG_FILE} \
    --output-dir ${OUTPUT_DIR} \
    --phase ${DATASET_PHASE} \
    --number ${BUNBER_IMAGES_DISPLAY} \
    --skip-type ${SKIP_TRANSFORM_TYPE}
    --mode ${DISPLAY_MODE} \
    --show \
    --adaptive \
    --min-edge-length ${MIN_EDGE_LENGTH} \
    --max-edge-length ${MAX_EDGE_LENGTH} \
    --bgr2rgb \
    --window-size ${WINDOW_SIZE}
Description of all arguments:
config: The path of a model config file.--output-dir: The output path for visualized images. If not specified, it will be set to'', which means not to save.--phase: Phase of visualizing dataset,must be one of[train, val, test]. If not specified, it will be set totrain.--number: The number of samples to visualize. If not specified, display all images in the dataset.--skip-type: The pipelines to be skipped. If not specified, it will be set to['ToTensor', 'Normalize', 'ImageToTensor', 'Collect'].--mode: The display mode, can be one of[original, pipeline, concat]. If not specified, it will be set toconcat.--show: If set, display pictures in pop-up windows.--adaptive: If set, automatically adjust the size of the visualization images.--min-edge-length: The minimum edge length, used when--adaptiveis set. When any side of the picture is smaller than${MIN_EDGE_LENGTH}, the picture will be enlarged while keeping the aspect ratio unchanged, and the short side will be aligned to${MIN_EDGE_LENGTH}. If not specified, it will be set to 200.--max-edge-length: The maximum edge length, used when--adaptiveis set. When any side of the picture is larger than${MAX_EDGE_LENGTH}, the picture will be reduced while keeping the aspect ratio unchanged, and the long side will be aligned to${MAX_EDGE_LENGTH}. If not specified, it will be set to 1000.--bgr2rgb: If set, flip the color channel order of images.--window-size: The shape of the display window. If not specified, it will be set to12*7. If used, it must be in the format'W*H'.
Note
If the
--modeis not specified, it will be set toconcatas default, get the pictures stitched together by original pictures and transformed pictures; if the--modeis set tooriginal, get the original pictures; if the--modeis set topipeline, get the transformed pictures.When
--adaptiveoption is set, images that are too large or too small will be automatically adjusted, you can use--min-edge-lengthand--max-edge-lengthto set the adjust size.
Examples:
Visualize all the transformed pictures of the
ImageNettraining set and display them in pop-up windows:
python ./tools/visualizations/vis_pipeline.py ./configs/resnet/resnet50_8xb32_in1k.py --show --mode pipeline
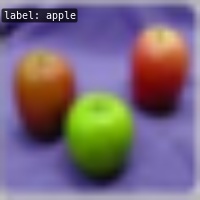
Visualize 10 comparison pictures in the
ImageNettrain set and save them in the./tmpfolder:
python ./tools/visualizations/vis_pipeline.py configs/swin_transformer/swin_base_224_b16x64_300e_imagenet.py --phase train --output-dir tmp --number 10 --adaptive

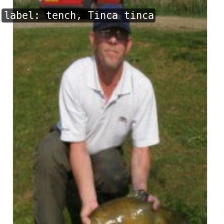
Visualize 100 original pictures in the
CIFAR100validation set, then display and save them in the./tmpfolder:
python ./tools/visualizations/vis_pipeline.py configs/resnet/resnet50_8xb16_cifar100.py --phase val --output-dir tmp --mode original --number 100 --show --adaptive --bgr2rgb
Learning Rate Schedule Visualization
python tools/visualizations/vis_lr.py \
    ${CONFIG_FILE} \
    --dataset-size ${DATASET_SIZE} \
    --ngpus ${NUM_GPUs}
    --save-path ${SAVE_PATH} \
    --title ${TITLE} \
    --style ${STYLE} \
    --window-size ${WINDOW_SIZE}
    --cfg-options
Description of all arguments:
config: The path of a model config file.dataset-size: The size of the datasets. If set,build_datasetwill be skipped and${DATASET_SIZE}will be used as the size. Default to use the functionbuild_dataset.ngpus: The number of GPUs used in training, default to be 1.save-path: The learning rate curve plot save path, default not to save.title: Title of figure. If not set, default to be config file name.style: Style of plt. If not set, default to bewhitegrid.window-size: The shape of the display window. If not specified, it will be set to12*7. If used, it must be in the format'W*H'.cfg-options: Modifications to the configuration file, refer to Tutorial 1: Learn about Configs.
Note
Loading annotations maybe consume much time, you can directly specify the size of the dataset with dataset-size to save time.
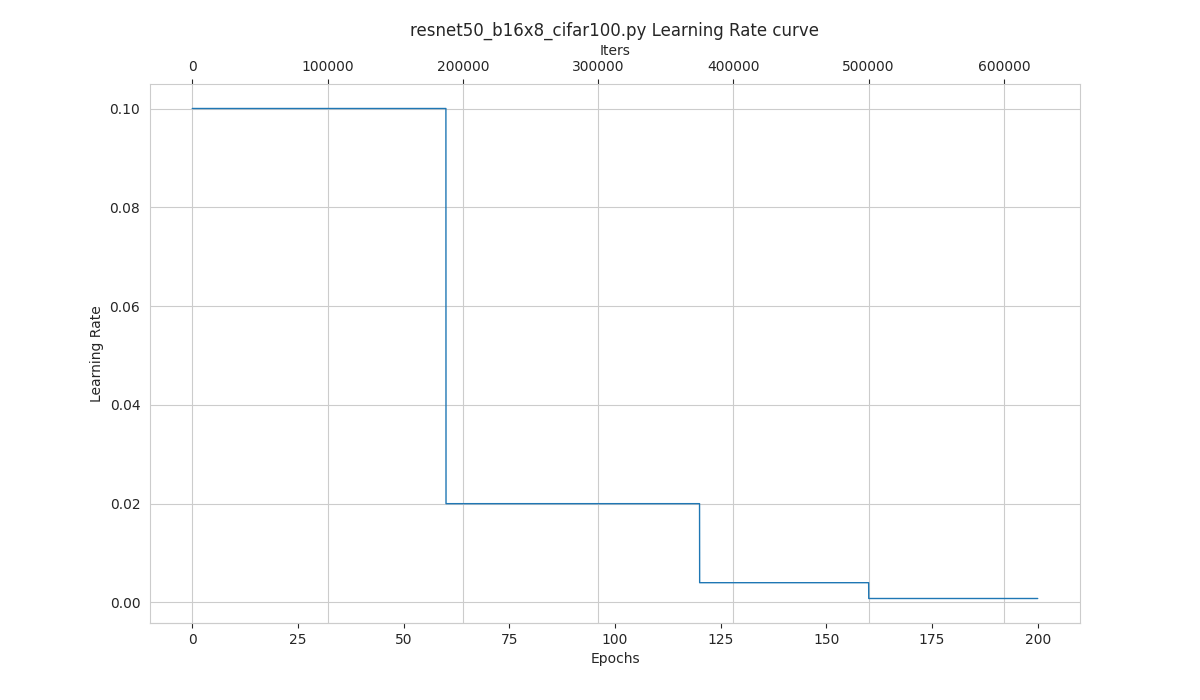
Examples:
python tools/visualizations/vis_lr.py configs/resnet/resnet50_b16x8_cifar100.py
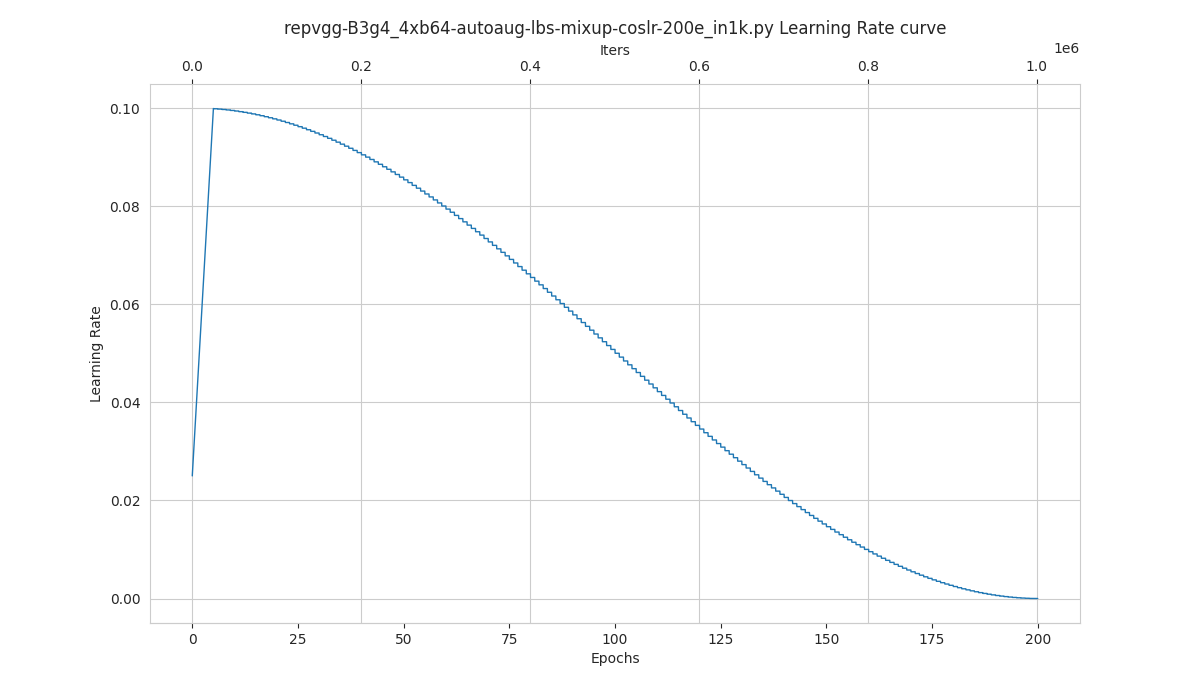
When using ImageNet, directly specify the size of ImageNet, as below:
python tools/visualizations/vis_lr.py configs/repvgg/repvgg-B3g4_4xb64-autoaug-lbs-mixup-coslr-200e_in1k.py --dataset-size 1281167 --ngpus 4 --save-path ./repvgg-B3g4_4xb64-lr.jpg
FAQs
None