Note
You are reading the documentation for MMClassification 0.x, which will soon be deprecated at the end of 2022. We recommend you upgrade to MMClassification 1.0 to enjoy fruitful new features and better performance brought by OpenMMLab 2.0. Check the installation tutorial, migration tutorial and changelog for more details.
Analysis
Log Analysis
Plot Curves
tools/analysis_tools/analyze_logs.py plots curves of given keys according to the log files.
python tools/analysis_tools/analyze_logs.py plot_curve  \
    ${JSON_LOGS}  \
    [--keys ${KEYS}]  \
    [--title ${TITLE}]  \
    [--legend ${LEGEND}]  \
    [--backend ${BACKEND}]  \
    [--style ${STYLE}]  \
    [--out ${OUT_FILE}]  \
    [--window-size ${WINDOW_SIZE}]
Description of all arguments:
json_logs: The paths of the log files, separate multiple files by spaces.--keys: The fields of the logs to analyze, separate multiple keys by spaces. Defaults to ‘loss’.--title: The title of the figure. Defaults to use the filename.--legend: The names of legend, the number of which must be equal tolen(${JSON_LOGS}) * len(${KEYS}). Defaults to use"${JSON_LOG}-${KEYS}".--backend: The backend of matplotlib. Defaults to auto selected by matplotlib.--style: The style of the figure. Default towhitegrid.--out: The path of the output picture. If not set, the figure won’t be saved.--window-size: The shape of the display window. The format should be'W*H'. Defaults to'12*7'.
Note
The --style option depends on seaborn package, please install it before setting it.
Examples:
Plot the loss curve in training.
python tools/analysis_tools/analyze_logs.py plot_curve your_log_json --keys loss --legend loss
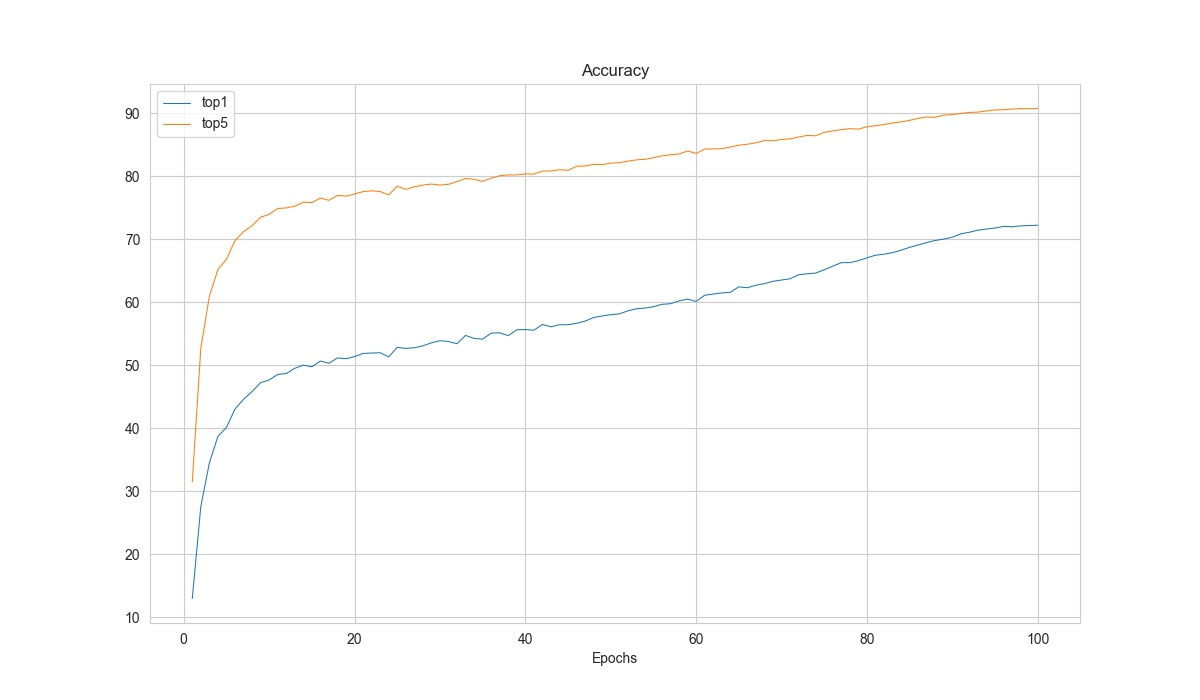
Plot the top-1 accuracy and top-5 accuracy curves, and save the figure to results.jpg.
python tools/analysis_tools/analyze_logs.py plot_curve your_log_json --keys accuracy_top-1 accuracy_top-5 --legend top1 top5 --out results.jpg
Compare the top-1 accuracy of two log files in the same figure.
python tools/analysis_tools/analyze_logs.py plot_curve log1.json log2.json --keys accuracy_top-1 --legend exp1 exp2
Note
The tool will automatically select to find keys in training logs or validation logs according to the keys.
Therefore, if you add a custom evaluation metric, please also add the key to TEST_METRICS in this tool.
Calculate Training Time
tools/analysis_tools/analyze_logs.py can also calculate the training time according to the log files.
python tools/analysis_tools/analyze_logs.py cal_train_time \
    ${JSON_LOGS}
    [--include-outliers]
Description of all arguments:
json_logs: The paths of the log files, separate multiple files by spaces.--include-outliers: If set, include the first iteration in each epoch (Sometimes the time of first iterations is longer).
Example:
python tools/analysis_tools/analyze_logs.py cal_train_time work_dirs/some_exp/20200422_153324.log.json
The output is expected to be like the below.
-----Analyze train time of work_dirs/some_exp/20200422_153324.log.json-----
slowest epoch 68, average time is 0.3818
fastest epoch 1, average time is 0.3694
time std over epochs is 0.0020
average iter time: 0.3777 s/iter
Result Analysis
With the --out argument in tools/test.py, we can save the inference results of all samples as a file.
And with this result file, we can do further analysis.
Evaluate Results
tools/analysis_tools/eval_metric.py can evaluate metrics again.
python tools/analysis_tools/eval_metric.py \
      ${CONFIG} \
      ${RESULT} \
      [--metrics ${METRICS}]  \
      [--cfg-options ${CFG_OPTIONS}] \
      [--metric-options ${METRIC_OPTIONS}]
Description of all arguments:
config: The path of the model config file.result: The Output result file in json/pickle format fromtools/test.py.--metrics: Evaluation metrics, the acceptable values depend on the dataset.--cfg-options: If specified, the key-value pair config will be merged into the config file, for more details please refer to Tutorial 1: Learn about Configs--metric-options: If specified, the key-value pair arguments will be passed to themetric_optionsargument of dataset’sevaluatefunction.
Note
In tools/test.py, we support using --out-items option to select which kind of results will be saved. Please ensure the result file includes “class_scores” to use this tool.
Examples:
python tools/analysis_tools/eval_metric.py configs/t2t_vit/t2t-vit-t-14_8xb64_in1k.py your_result.pkl --metrics accuracy --metric-options "topk=(1,5)"
View Typical Results
tools/analysis_tools/analyze_results.py can save the images with the highest scores in successful or failed prediction.
python tools/analysis_tools/analyze_results.py \
      ${CONFIG} \
      ${RESULT} \
      [--out-dir ${OUT_DIR}] \
      [--topk ${TOPK}] \
      [--cfg-options ${CFG_OPTIONS}]
Description of all arguments:
config: The path of the model config file.result: Output result file in json/pickle format fromtools/test.py.--out-dir: Directory to store output files.--topk: The number of images in successful or failed prediction with the highesttopkscores to save. If not specified, it will be set to 20.--cfg-options: If specified, the key-value pair config will be merged into the config file, for more details please refer to Tutorial 1: Learn about Configs
Note
In tools/test.py, we support using --out-items option to select which kind of results will be saved. Please ensure the result file includes “pred_score”, “pred_label” and “pred_class” to use this tool.
Examples:
python tools/analysis_tools/analyze_results.py \
       configs/resnet/resnet50_b32x8_imagenet.py \
       result.pkl \
       --out-dir results \
       --topk 50
Model Complexity
Get the FLOPs and params (experimental)
We provide a script adapted from flops-counter.pytorch to compute the FLOPs and params of a given model.
python tools/analysis_tools/get_flops.py ${CONFIG_FILE} [--shape ${INPUT_SHAPE}]
Description of all arguments:
config: The path of the model config file.--shape: Input size, support single value or double value parameter, such as--shape 256or--shape 224 256. If not set, default to be224 224.
You will get a result like this.
==============================
Input shape: (3, 224, 224)
Flops: 4.12 GFLOPs
Params: 25.56 M
==============================
Warning
This tool is still experimental and we do not guarantee that the number is correct. You may well use the result for simple comparisons, but double-check it before you adopt it in technical reports or papers.
FLOPs are related to the input shape while parameters are not. The default input shape is (1, 3, 224, 224).
Some operators are not counted into FLOPs like GN and custom operators. Refer to
mmcv.cnn.get_model_complexity_info()for details.
FAQs
None